")
")
Summary of the Dumas effect at the time of the creation of this offical site.
Summary of the numerous “anomalies” observed in connection with the Dumas effect over the last three years.
- Energy anomalies
- Elementary anomalies
- Mechanical anomalies
ENERGY ANOMALIES
A) Initial observation (obvious thermo electrical discrepancies)
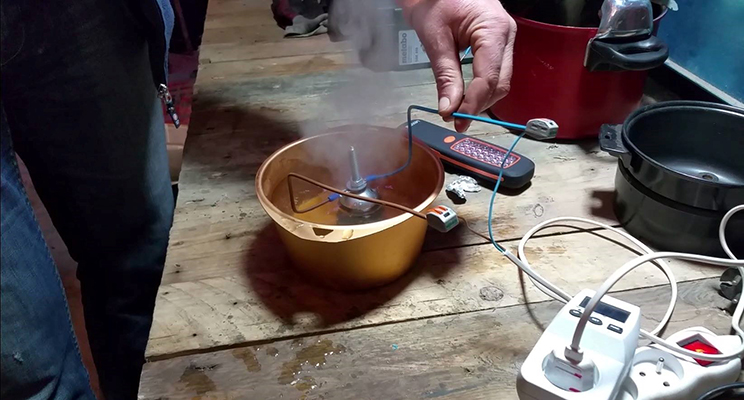
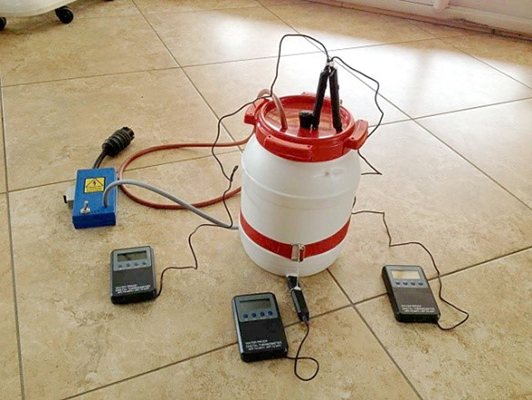
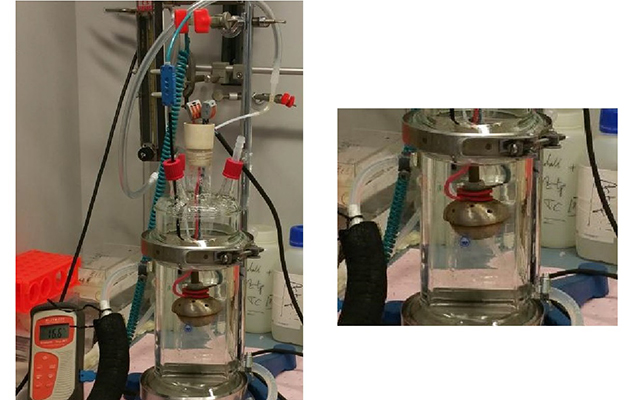
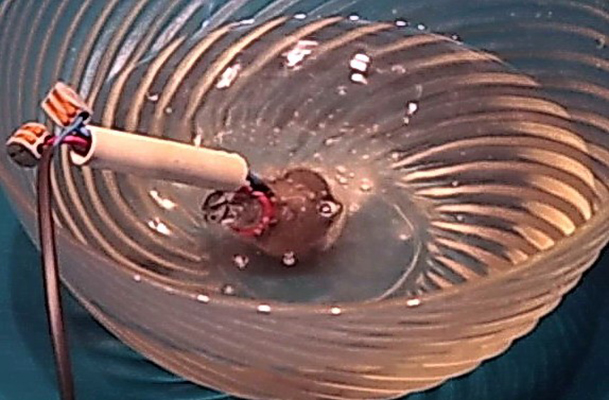
When JC Dumas developed his process, he measured the electrical intensity and the increase in temperature of a resonator plunged into a 10-litre bucket of water.
At the time he noted that the intensity diminished while the temperature increased regularly.
It was this “detail” that drew his attention and encouraged him to pursue his research. As he had no academic training or scientific help, he could not formalise this phenomenon at the time.
This phenomenon remains a thermodynamic impossibility within the frame of the workings of a passive system, as we demonstrated afterwards in three different ways.
B) “The test in Nice” (static calorimetry).
Several people with a solid scientific background were present that day.
The test was carried out under their control. Nobody came forward to record the mixture of water at the end of the experiment in order to measure the final homogenised temperature of the volume as a whole. This mixture was however carried out at length by JCD’s collaborator during the test.
The experiment carried out that day showed an output reaching 116%.
The report’s final conclusion states that a number of questions have to be asked and must lead to “seeking expertise by a laboratory known for its great scientific rigour in theoretical physics and competent in applied physics”. Curiously several organisms that were contacted, one of which was APAV, declined the requests for estimates made by JCD.
C) X-Shaped Curve (test on the increase in temperature).
The graph resulting from these data showed an X-shaped curve.

Employed by a company in order to develop his process, JCD benefited from collaboration with an engineer specialised in currents.
The team was able to reproduce JCD’s initial observation many times:
- rconnected to the mains, plunged into tap water
- the thermal power developed by the system was constant between 25°C and 90°C
- The intensity, i.e. the electrical power supplied to the system, diminished
From the start this obviously showed a thermo electrical discrepancy in the behaviour in an appliance that was supposed to be passive.
This thermo electrical discrepancy became even more obvious when the experiment was compared to that carried out with a resistance. The comparative profiles are not comparable.
The X-shaped profile enables us to demonstrate scientifically in three different ways that an energy anomaly exists that is incompatible with the operation of a passive energy receiver.
D) Israeli test (calorimetric flow).
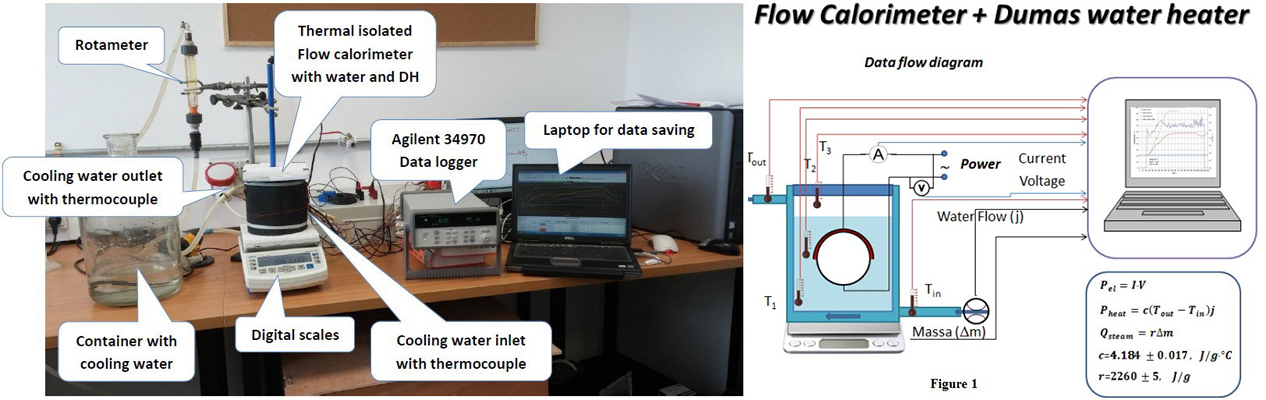
As a result of our publications, a Swiss philanthropist financed a thermodynamic study in calorimetry flow that was carried out by Israeli engineers.
Strangely, the experiment was not continued long enough to attain stationary operation.
However, generally speaking, a reliable means of obtaining an energy balance in a system is to run it under a stationary operation. Thus, the system is governed by so-called linear equations that are simple to solve.
Also strangely, the curves of the final energy diagram exclude 400 seconds of data.
Finally, and again strangely, the energy accumulated by the system is excluded from the energy balance.
A strict control of the results available shows however an average thermal power developed over 1560 seconds, going from 101% to 105%, compared to the average electrical power output over the same period.
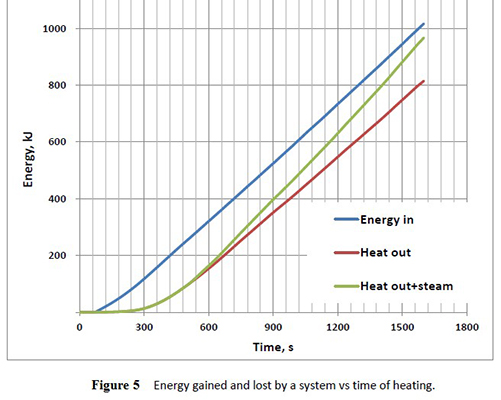
A study of the tangent of energy curves also shows an instantaneous power output above the maximum input of power.
The test enables us to show beyond any doubt that the system under study is more powerful than the energy source that feeds it: 177% of its input power.
E) Test by current frequency variation
Published 8 March 2017
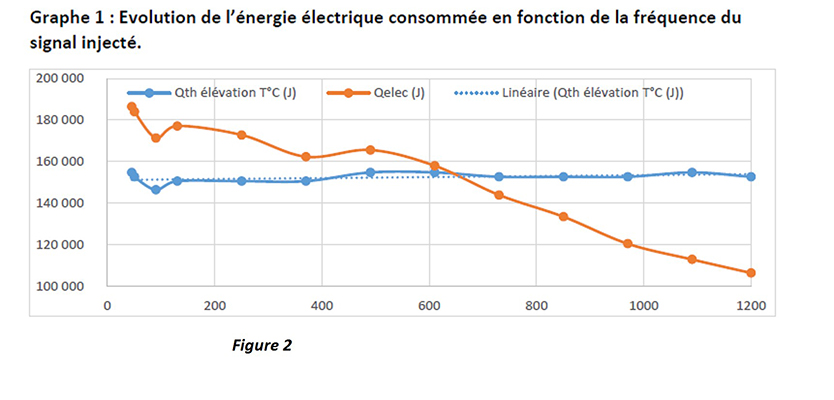
Very early on our team noted the influence of frequency on the phenomenon’s intensity. This was clearly stated in the 26 October 2015 publication.
After these discussions, JCD carried out a calorimetric experiment in non-adiabatic conditions supplied by a variable-frequency generator.
The experiment showed an increase in output with the frequency of the current feed-in.
F) Instantaneous infrared electroluminescence
Indeed, infrared photography of the system from the first second shows a photonic energy anomaly:

Quite a few cybernauts have suggested that our results are explained by the Joule effect. The Joule effect cannot explain all the energy phenomena.
JCD and his engineer team mate have been able to prove this. They were able to prove the existence of an effect distinct from the Joule effect from the very first second of operation of the resonator plunged into water and connected to the mains.
Indeed, infrared photography of the system from the first second shows a photonic energy anomaly:
- the water is at room temperature (25°C)
- whilst the surface temperature shows an isotherm between 40 and 41°C
- the isotherm is present a distance away from the resonator and from the first second
- the isotherm contrasts with a temperature gradient typical of the effects of radiation, conduction and convection following the Joule effect.
Therefore surface energy phenomena exist that cannot be attributed to the Joule effect.
G) Calorimetry in adiabatic conditions
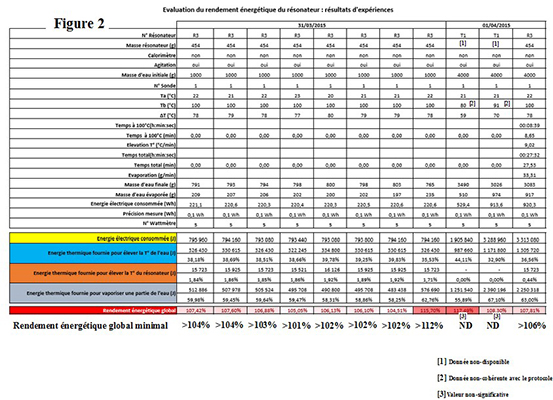
Several measurements were carried out.
Taking into account measurement uncertainties, the calculations show an output of 104% in experimental phases.
H) Chemical reactivity of the system
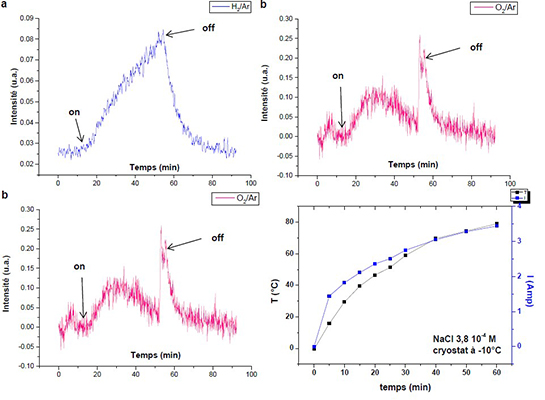
A study carried out by the AEC shows an electrolysis chemical output over time with an increase in the flow of hydrogen gas.
This increase is multiplied tenfold, and is incompatible with an increase in output linked to an increase in temperature of 85°C.
Such high proportions show a drastic change in the chemical reactivity of the system with an electrolysis activation energy reduction.
ELEMENTARY ANOMALIES
A) Missing mass in mass spectrometry
A study by the AEC already quoted shows that the chemical reactivity of the system relative to the formation of H2 increases in proportions that are not compatible with the system’s temperature changes.
The same study also shows a two-phase evolution in the production of oxygen, decoupled from the H2 production profile.
This decoupling may be interpreted as a mass anomaly, with identification of a missing mass for mass 32.
It could also be a result of an increase in the consumption of O2 until all the O2 produced is consumed through oxidation of the electrodes used.
B) Mssing type of chemical
The physical chemist, Dr P. Bacelon, was able to settle the matter of the existence of an elementary anomaly.
By replacing steel electrodes by graphite ones, he and JF Ricois were able to demonstrate the absence of explosivity of the gases.
They thus demonstrated a disturbance of the electrolysis stoichiometric ratio, with a deficit in the H2 present of 1/24 instead of 2/1.
The identification of a stoichiometric alteration in a ratio of 48/1 is the undeniable physico-chemical sign of an elementary anomaly.
This experiment confirmed therefore the existence of elementary anomalies found in mass spectrometry while the Dumas resonator was operating.
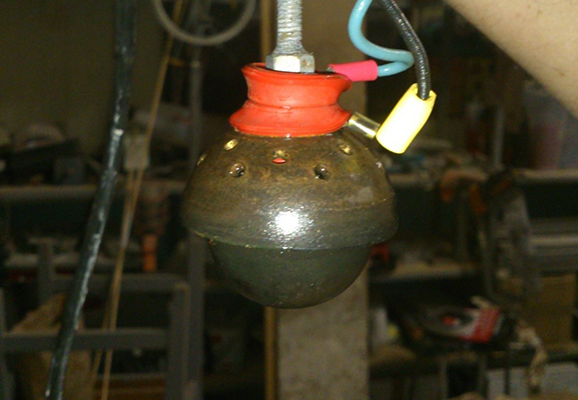
MECHANICAL ANOMALIES: DESTRUCTION OF ELECTRODES
A) Operating in extra pure water
This publication shows without a doubt that the process implied in the destruction of the electrodes employs mechanical components.
Indeed, analysis of the solution par ICP-EOS shows that the iron element disappears after filtering through a 0.2µm mesh sieve.
The resonator operates by physical cleansing of the metal mass, which is a violent process that can tear away the particles of several billion atoms of iron.
B) Operating in tap water
P. Bacelon and JF Ricois carried out additional tests that identified a mechanical component in the destruction of electrodes.
After operating the resonator in water and subjected to current from the mains, they noted that the particles present in suspension reacted to the magnetic field and adhered to a neodymium magnet.
An examination of the particles on the surface of the magnet enabled Ricois to detect a bright appearance in the residue shown to the light that is typical of a metal fragment.
An examination under a microscope of the ferromagnetic residue showed steel-grey coloured particles adhering to a magnet.
These experiments are the macroscopic proof that the electrodes are responsible for a phenomenon of physical erosion of mechanical origin.
CHEMICAL ANOMALIES
A) Réactivité chimique du système
The AEC has demonstrated the reality of the resonator as a chemical reactor.
This reactivity goes beyond electrolysis.
The resonator is capable of producing the same bodies as the ultrasonic probes in sonochemistry (CH4, CO, H2, C2H2) and other bodies (CO2) showing degrees of greater oxidation (CO2).
This shows that the resonator is capable of ensuring the cracking and reorganisation of carbon chains at temperatures between 80°C and 100°C.
This type of process is usually the result of high temperature reactions (steam cracking), under hyperbaric conditions (very high pressure catalysis), as well as high energy (sonochemistry)
CONCLUSION
The potential in research and development is enormous and is most likely underestimated.
Identifying and exploiting this potential require means.
At the moment the team is relying on fate, something that depends on all of us.
Yours truly,
JF Ricois